How to Setup Collectl – Linux Performance Monitoring
collectl is a very nice feature-rich command-line utility that can be used to collect performance data that describes the current system status. Unlike most of the other monitoring tools, collectl does not focus on a limited number of system metrics, instead, it can gather information on many different types of system resources such as cpu, disk, memory, network, sockets, tcp, inodes, infiniband, cluster, memory, nfs, processes, quadrics, slabs, and buddyinfo.
A very good thing about using collectl is that it can also play the role of utilities that are designed with only a specific purpose such as top, ps, iotop, and many others.
Collectl Features
- It can run interactively, as a daemon, or both.
- It can display the output in many formats.
- It has the ability to monitor almost any subsystem.
- It can play the role of many other utilities such as ps, top, iotop, and vmstat.
- It has the ability to record and playback the captured data.
- It can export data in various file formats. (this is very useful when you want to analyze the data with external tools).
- It can run as a service to monitor remote machines or an entire server cluster.
- It can display the data in the terminal, and write to a file or a socket.
Install collectl in Linux
For CentOS, AlmaLinux:
yum update -y
yum install collectl -y
For Debian/Ubuntu:
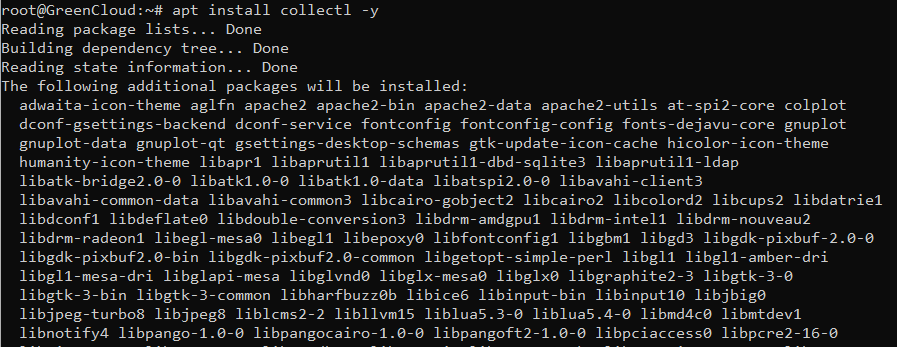
apt update -y
apt install collectl -y
Using Collectl Monitoring Tool in Linux
Once the installation of the collectl tool is finished, you can easily run it from the terminal, even without any option. The following command will display information on cpu, disk, and network stats in a very short and human-readable format.
collectl
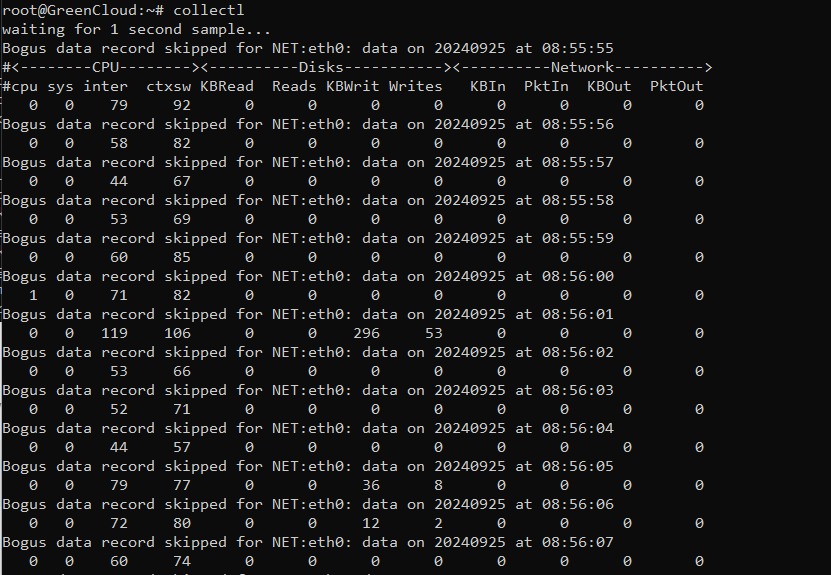
When the collectl utility is executed without any option it displays information about the following subsystems:
- cpu
- disks
- network
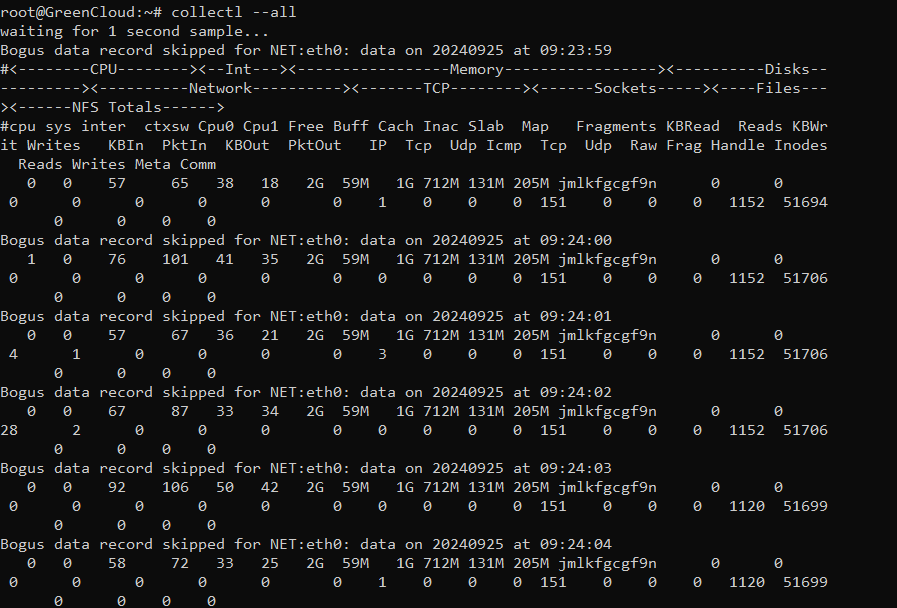
You can also display statistics for all subsystems except slabs by combining the command with the --all option as shown below.
collectl --all
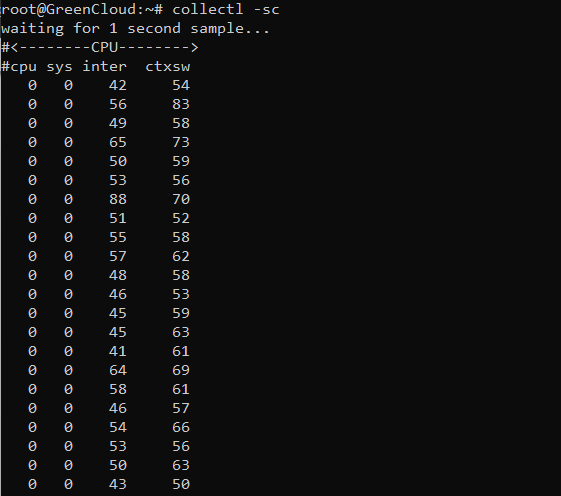
But, how do you monitor the cpu usage with the help of the utility? The -s option should be used to control which subsystem data is to be collected or played back.
For example, the following command can be used to monitor the summary of the cpu usage.
collectl -sc
You can easily understand that the default option is “cdn“, it stands for cpu, disks, and network data. The result of the command is the same as the output of “collectl -scn”
collectl -scdn
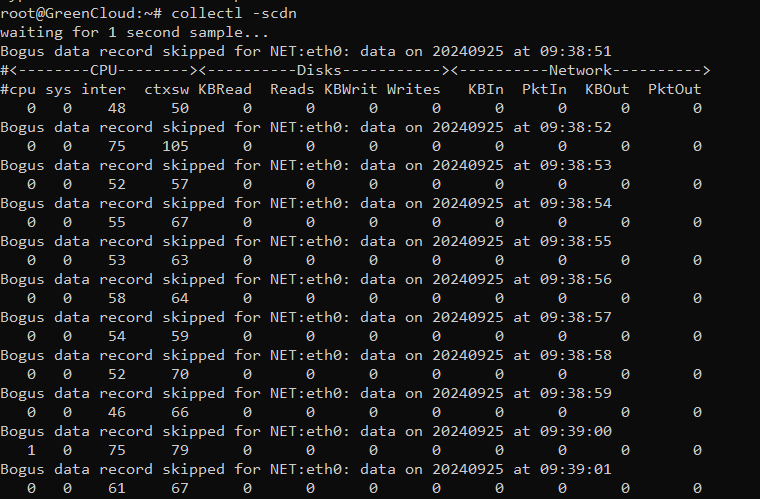
If you want to collect data about the memory, use the following command.
collectl -sm
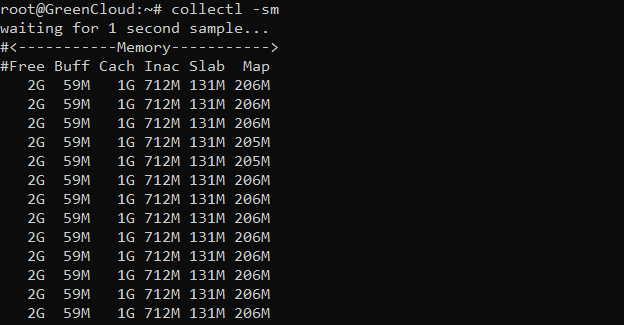
The above output is very useful when you want to get some detailed information on your memory usage, free memory, and other important stuff for the performance of your system.
Summary list of subsystems supported by this tool.
b– buddy info (memory fragmentation)c– CPUd– Diskf– NFS V3 Datai– Inode and File Systemj– Interruptsl– Lustrem– Memoryn– Networkss– Socketst– TCPx– Interconnecty– Slabs (system object caches)
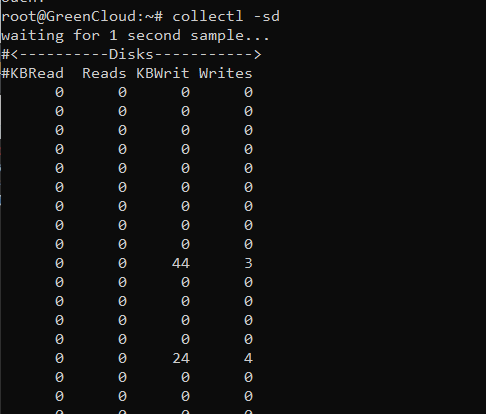
A very important piece of data for a system administrator or a Linux user is the data collected on disk usage. The following command will help you to monitor disk usage.
collectl -sd
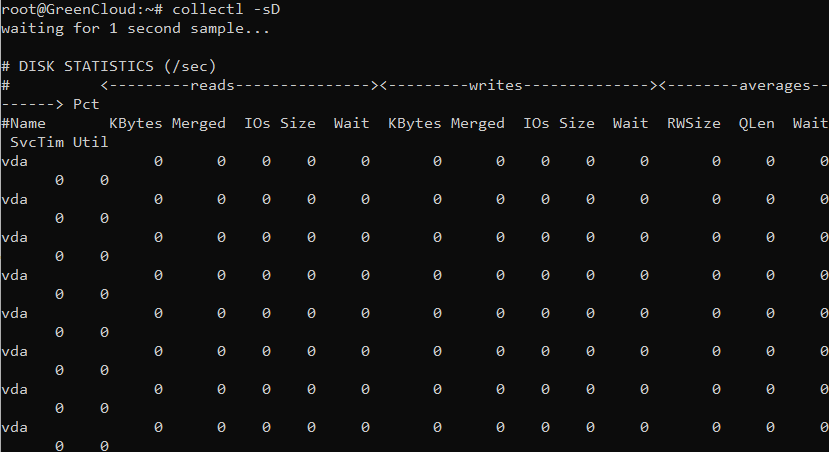
You can also use the “-sD” option to collect data on individual disks, but you have to know that information on total disks will not be reported.
collectl -sD
You can also use other detail subsystems to collect detailed data. The following is a list of the detailed subsystems.
C– CPUD– DiskE– Environmental data (fan, power, temp), via ipmitoolF– NFS DataJ– InterruptsL– Lustre OST detail OR client Filesystem detailN– NetworksT– 65 TCP counters only available in plot formatX– InterconnectY– Slabs (system object caches)Z– Processes
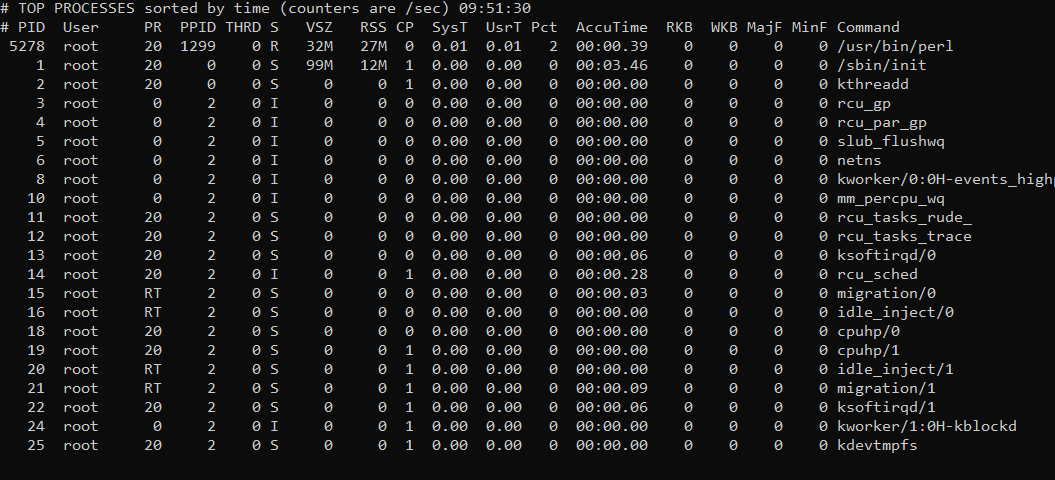
It is very easy to make collectl work as the top utility, run the following command in your terminal and you will see a similar output in the top tool gives you when it is executed in your Linux system.
collectl --top
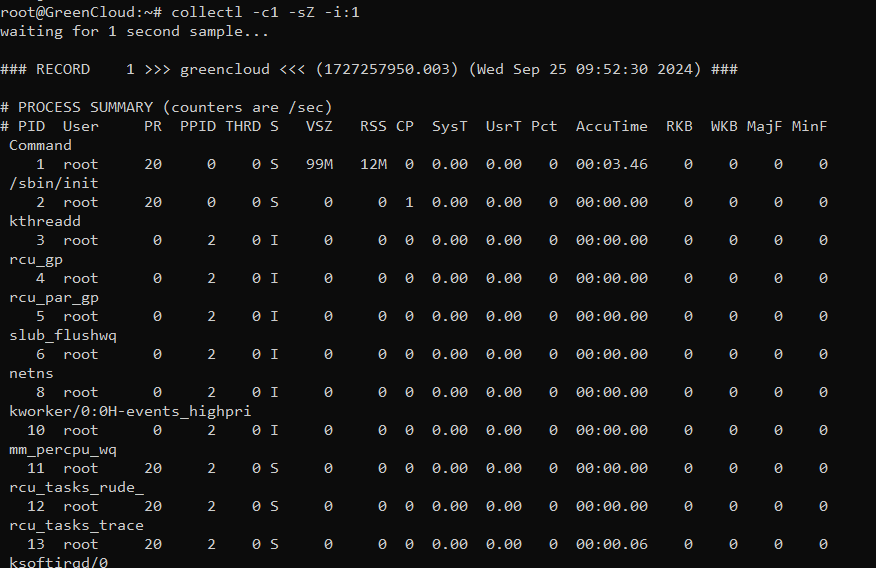
And now last but not least, to use the collectl utility as the ps tool run the following command in your terminal. You will get information about processes in your system the same way as you do when you run the “ps” command in your terminal.
collectl -c1 -sZ -i:1
Getting help
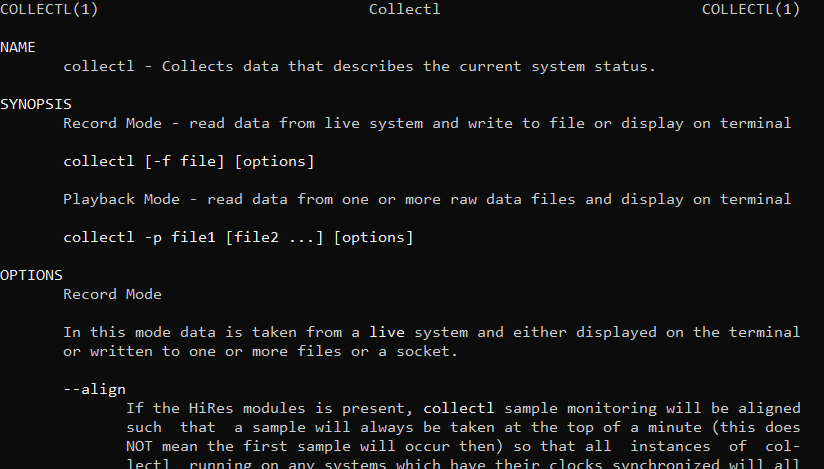
Read man page:
man collectl
Conclusion
That’s all the features of collectl, we hope this article will be useful for you. Good luck!