How to Monitor Windows OS Using Nagios Core
This article describes how to monitor Windows machines “private” services such as CPU load, Disk usage, Memory usage, Services, etc. For this, we were required to install an NSClient++ addon on the Windows machine. The addon acts as a proxy between the Windows machine and Nagios and monitors actual services by communicating with the check_nt plugin. The check_nt plugin is already installed on the Nagios Monitoring Server if you follow our Nagios installation guide.
We assume that you’ve already installed and configured the Nagios server according to our following guides.
- https://green.cloud/docs/how-to-install-and-configure-nagios-4-on-ubuntu-22-04/
- https://green.cloud/docs/how-to-install-nagios-open-source-monitoring-on-debian-11/
To monitor Windows Machines you will need to follow several steps and they are:
- Install the NSClient++ addon on the Windows Machine.
- Configure Nagios Server for monitoring Windows Machine.
- Add new host and service definitions for Windows machine monitoring.
- Restart the Nagios Service.
To make this guide simple and easier, a few configurations have already been made for you in the Nagios installation.
- A check_nt command definition has already been added to the command.cfg file. This definition command is used by the check_nt plugin to monitor Windows services.
- A Windows-server host template has already been created in the templates.cfg file. This template allows you to add new Windows host definitions.
The above two files “command.cfg” and “templates.cfg” files can be found at /usr/local/nagios/etc/objects/ directory. You can modify and add your definitions that suit your requirements. But, I’d recommend you to follow the instructions described in this article and you will be successfully monitoring your Windows host in less than 20 minutes.
Step 1: Installing NSClient++ Agent on Windows Machine
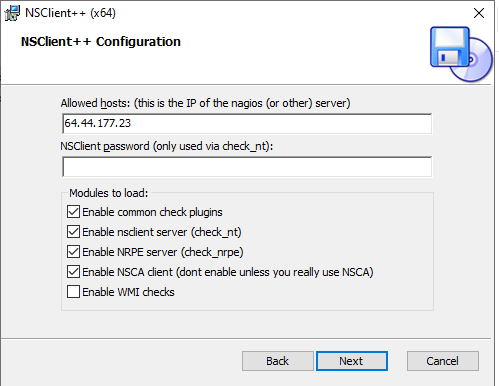
Please use the below instructions to install NSClient++ Agent on the Remote Windows Host. First download the latest stable version NSCP-0.4.1.73-x64 addon source files, which can be found at the below link:
http://sourceforge.net/projects/nscplus/
When we download the new version (usually according to the 32-bit or 64-bit Windows version, we are installing the NSCP-0.4.1.73-x64 version), we just need to click Next to install, to the next step, we fill in the IP address of the Nagios Server server and the necessary cell modules. If we set the password in the NSClient password entry (only users via check_nt), we will configure it on the Nagios Server, otherwise, it will stop. (Password protection step below).
Open the Windows Services Manager and right-click on NSClient go to Properties then the ‘Log On‘ tab and click the check box that says “Allow service to interact with the desktop“. If it isn’t already allowed, please check the box to allow it to.
Step 2: Configuring Nagios Server and Add Windows Hosts
Now Login into Nagios Server and add some object definitions in Nagios configuration files to monitor the new Windows machine. Open windows.cfg file for editing with Vi editor.
nano /usr/local/nagios/etc/objects/windows.cfg
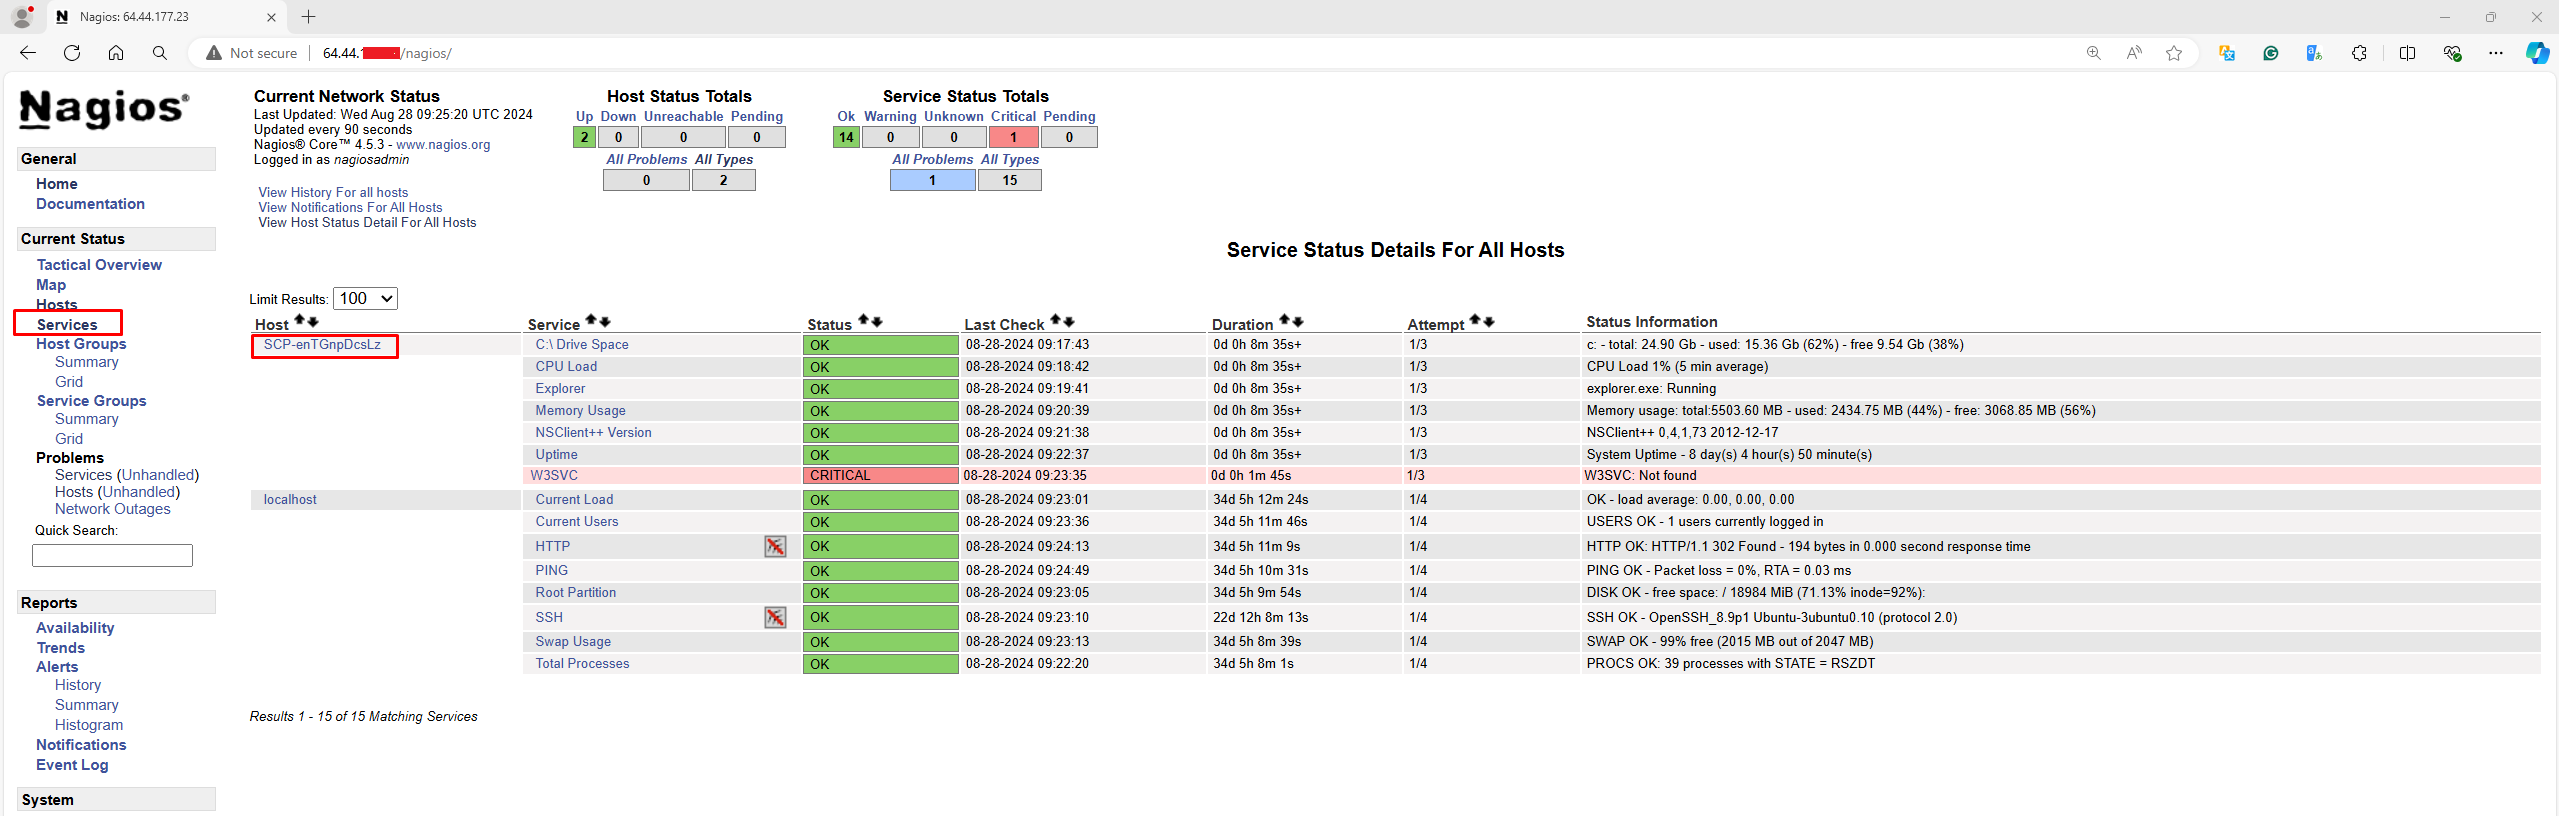
A sample Windows host definition is already defined for the Windows machine, you can simply change the host definition like host_name, alias, and address fields to the appropriate values of your Windows machine.
define service{
	use			generic-service
	host_name		SCP-enTGnpDcsLz (winserver)
	service_description	NSClient++ Version
	check_command		check_nt!CLIENTVERSION
	}

Add the following service definition to monitor the uptime of the Windows server.

define service{
	use			generic-service
	host_name		SCP-enTGnpDcsLz (winserver)
	service_description	Uptime
	check_command		check_nt!UPTIME
	}

Add the following service definition to monitor the CPU utilization on the Windows server and generate a CRITICAL alert if the 5-minute CPU load is 90% or more or a WARNING alert if the 5-minute load is 80% or greater.

define service{
	use			generic-service
	host_name		SCP-enTGnpDcsLz (winserver)
	service_description	CPU Load
	check_command		check_nt!CPULOAD!-l 5,80,90
	}

Add the following service definition to monitor memory usage on the Windows server and generate a CRITICAL alert if memory usage is 90% or more or a WARNING alert if memory usage is 80% or greater.

define service{
	use			generic-service
	host_name		SCP-enTGnpDcsLz (winserver)
	service_description	Memory Usage
	check_command		check_nt!MEMUSE!-w 80 -c 90
	}

Add the following service definition to monitor usage of the C:\ drive on the Windows server and generate a CRITICAL alert if disk usage is 90% or more or a WARNING alert if disk usage is 80% or greater.

define service{
	use			generic-service
	host_name		SCP-enTGnpDcsLz (winserver)
	service_description	C:\ Drive Space
	check_command		check_nt!USEDDISKSPACE!-l c -w 80 -c 90
	}

Add the following service definition to monitor the W3SVC service state on the Windows machine and generate a CRITICAL alert if the service is stopped.

define service{
	use			generic-service
	host_name		SCP-enTGnpDcsLz (winserver)
	service_description	W3SVC
	check_command		check_nt!SERVICESTATE!-d SHOWALL -l W3SVC
	}

Add the following service definition to monitor the Explorer.exe process on the Windows machine and generate a CRITICAL alert if the process is not running.

define service{
	use			generic-service
	host_name		SCP-enTGnpDcsLz (winserver)
	service_description	Explorer
	check_command		check_nt!PROCSTATE!-d SHOWALL -l Explorer.exe
	}
Lastly, uncomment the windows.cfg file in /usr/local/nagios/etc/nagios.cfg.
nano /usr/local/nagios/etc/nagios.cfg
Finally, verify the Nagios configuration files for any errors.
/usr/local/nagios/bin/nagios -v /usr/local/nagios/etc/nagios.cfg
If the verification process throws any error messages, fix those errors until the verification process completes without any error messages. Once you fix those errors, restart the Nagios service.
service nagios restart
That’s it. Now go to Nagios Monitoring Web interface at “http://Your-server-IP-address/nagios” or “http://FQDN/nagios” and Provide the username “nagiosadmin” and password. Check that the Remote Windows Host was added and is being monitored.
Summary
That’s it! for now, in my upcoming article, I will show you how to add a Printer and Switches to Nagios Monitoring Server. If you’re having any difficulties while adding a Windows host to Nagios. Please do comment your queries via the comment section, till then stay tuned to Greencloud for more such kind of valuable articles.
