How to Install Grafana on Ubuntu 20.04
Introduction
Grafana is a free, open-source, and composable observability and data visualization platform. It is used for monitoring, analysis, and visualization of real-time system data. Its frontend is written in Typescript while the backend is written in Go. It can be used with time series databases such as InfluxDB, Prometheus, and Elasticsearch. It provides a beautiful dashboard that allows users to create and edit both log and data graphs and create metrics.
In this post, we will explain how to install Grafana on Ubuntu 20.04.
Prerequisites
- A Ubuntu 20.04 VPS with root access enabled or a user with sudo privileges.
Log in via SSH and Update your System
First, you will need to log in to your Ubuntu 20.04 VPS via SSH as the root user
Next, run the following commands to upgrade all installed packages on your VPS:
apt-get update -y
apt-get upgrade -y
Once all the packages are updated, restart your system to apply the changes.
Add Grafana Repository
By default, the Grafana package is not included in the Ubuntu 20.04 default repository. So you will need to add the Grafana official repository to your system.
First, install all required dependencies using the following command:
apt-get install wget curl gnupg2 apt-transport-https software-properties-common -y
Next, download and add the Grafana GPG key with the following command:
wget -q -O - https://packages.grafana.com/gpg.key | apt-key add -
Next, add the Grafana repository to APT using the following command:
echo "deb https://packages.grafana.com/oss/deb stable main" | tee -a /etc/apt/sources.list.d/grafana.list
Once the repository is added to your system, you can update it with the following command:
apt-get update -y
Install Grafana
Now, you can install the Grafana by running the following command:
apt-get install grafana -y
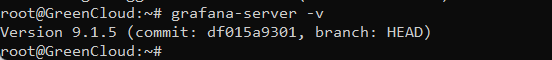
Once the Grafana package is installed, verify the Grafana version with the following command:
grafana-server -v
You will get the following output:
Now, start the Grafana service and enable it to start at system reboot:
systemctl start grafana-server
systemctl enable grafana-server
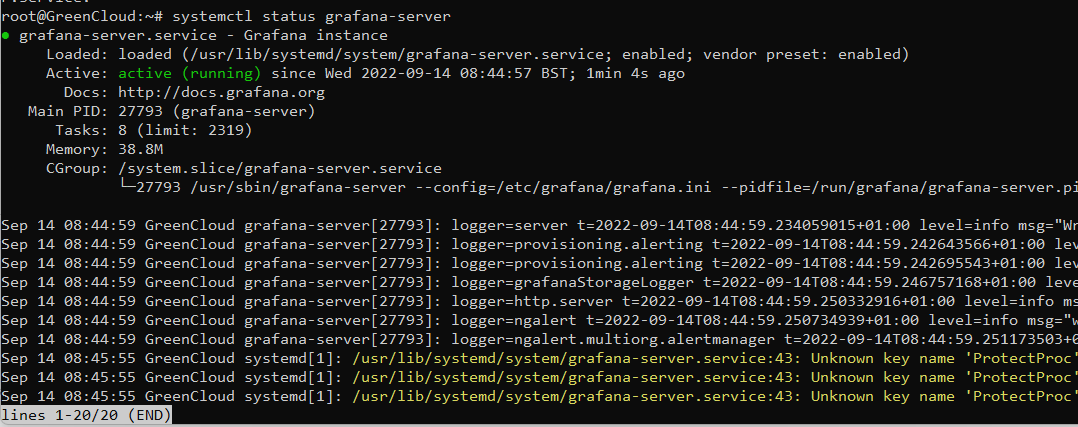
You can now check the status of the Grafana with the following command:
systemctl status grafana-server
You will get the following output:
Open Port on Firewall (Optional)
Grafana default http port is 3000, you’ll need to allow access to this port on the firewall. Ubuntu comes with ufw firewall. You can install it using:
sudo apt -y install ufwThen enable the firewall service:
sudo ufw enableOpen the port on the firewall:
sudo ufw allow ssh
sudo ufw allow 3000/tcp
At this point, Grafana is started and listens on port 3000. You can check it with the following command:
ss -antpl | grep 3000
You should see the following output:

Access Grafana Dashboard
Access Grafana Dashboard using the server IP address or hostname and port 3000.
Default logins are:
Username: admin
Password: admin
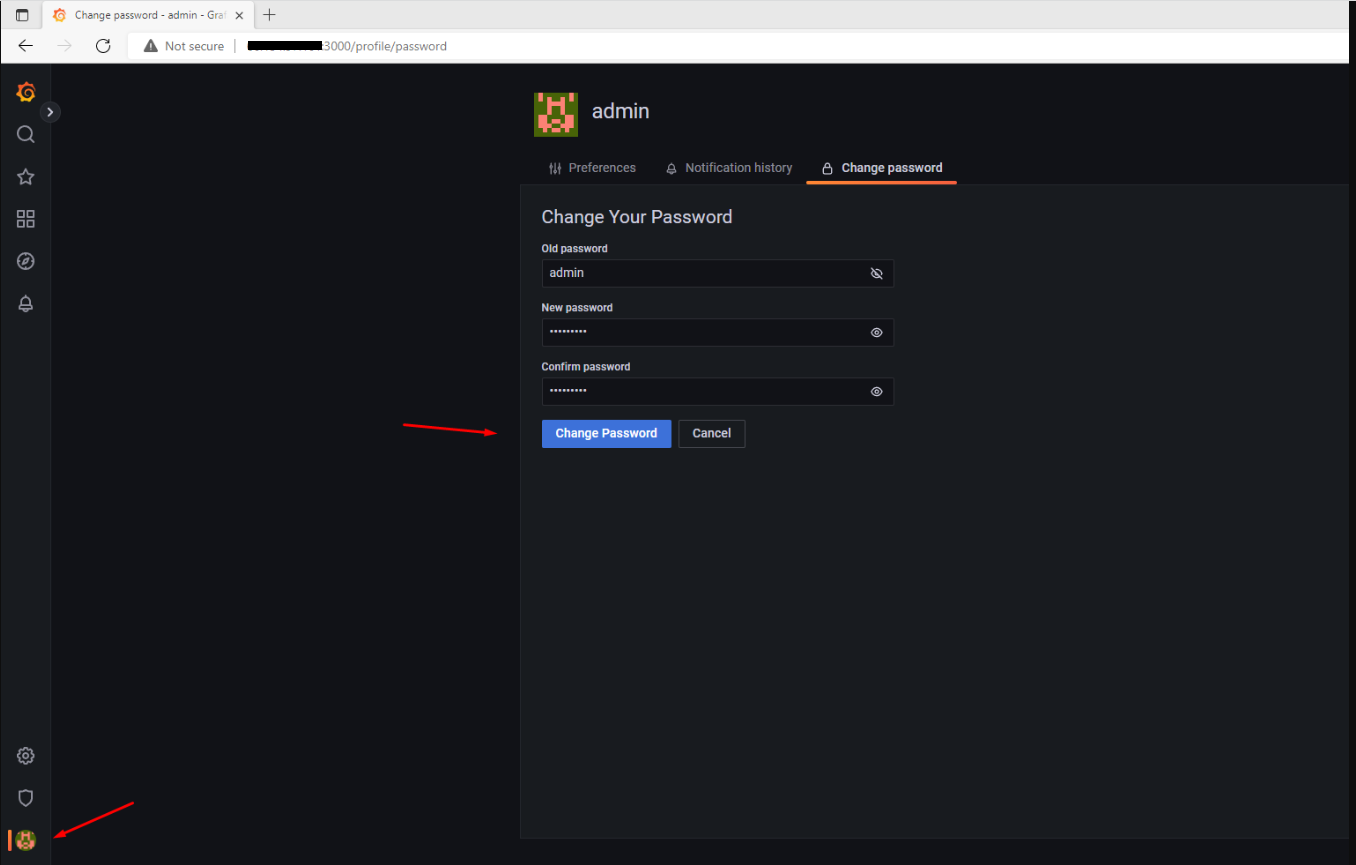
Change admin Password
Remember to change admin password from default admin. Login and navigate to:
Preferences > Change Password
Sumary
PS. If you liked this post about how to install Grafana on Ubuntu 20.04 VPS, please share it with your friends on the social networks using the buttons below, or simply leave a comment in the comments section. Thanks.