How to Monitor Network Bandwidth on Linux Server
Introduction
Monitoring network performance is important for preventing malfunctions and ensuring quality. Such a practice tells you whether your network is running slow and what may be the cause of such an issue. This is done by monitoring your network bandwidth usage.
There are many different tools for monitoring network traffic on a Linux server. Each option has its strengths and weaknesses. Most of the command-line utilities are designed to be lightweight and easy to use. Some are designed to present a basic overview, while others provide detailed data.
This guide compares the best Linux network monitoring tools.
Prerequisites
- Access to a user account with sudo or root privileges
- For CentOS and RHEL Linux, the EPEL (Extra Packages for Enterprise Linux) repositories must be available.
- A package manager tool (yum or apt)
- A terminal window/command line (Ctrl-Alt-T, Ctrl-Alt-F2)
9 Best Network Monitoring Tools For Linux
If you are looking for a quick display of network bandwidth, a command-line monitoring tool will do the job. If you need a detailed graph of usage for the month, graphical options may provide a better solution.
Overall usage reports can help determine bandwidth requirements, while more detailed process-level reports can help identify the source of high bandwidth usage.
Real-time reporting can alert you to usage spikes or unusual patterns when they occur.
Before You Start, Install EPEL
CentOS users first need to install the EPEL software.
For RHEL and CentOS 7.x:
1. Open a terminal window, and enter the following:
yum -y install epel-release
2. Refresh the repositories:
yum repolist
Linux servers are often configured without a graphical interface to save system resources. These applications can run and display from a command line.
iftop Display Bandwidth Usage
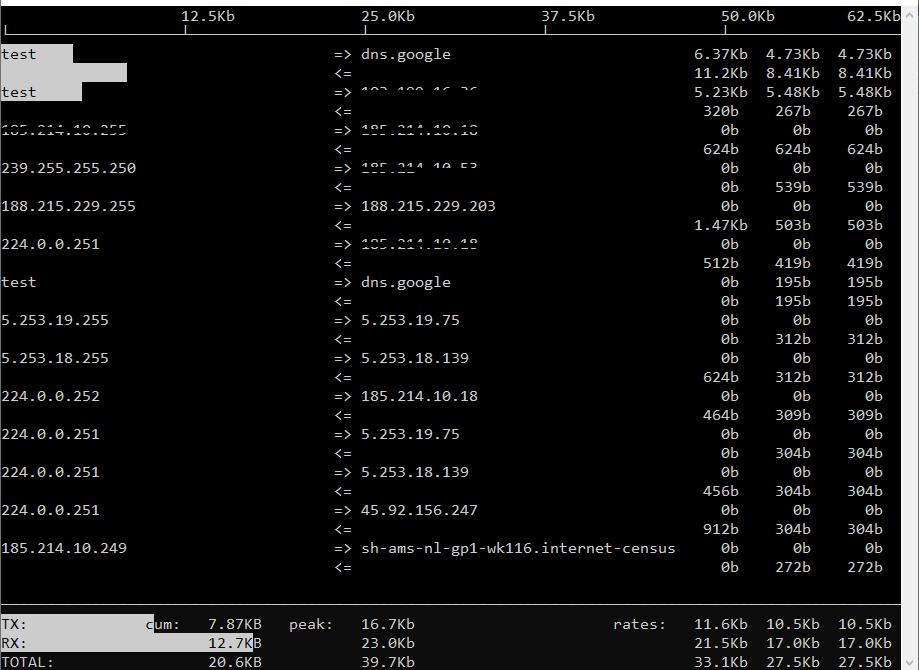
If you are familiar with the top command for monitoring processor usage, you will find the iftop command very similar. iftop provides a real-time display of bandwidth usage by individual connection. It also generates an overview of the amount of bandwidth being used.
One limitation in iftop is that it does not track traffic by process ID (PID).
To install iftop:
RHEL / CentOS
yum install iftop -yDebian / Ubuntu
sudo apt-get install iftop
To monitor a different network interface, e.g: eth0 , you would need to pass the interface name to the iftop command using the -i parameter:
# iftop -i eth0To disable hostname lookups, use the -n flag.
# iftop -n eth0
To turn on port display, use the -P switch.
# sudo iftop -P eth0
This concludes our tutorial. For more information on how to use iftop, please refer to iftop’s website.
nload Displays Network Usage
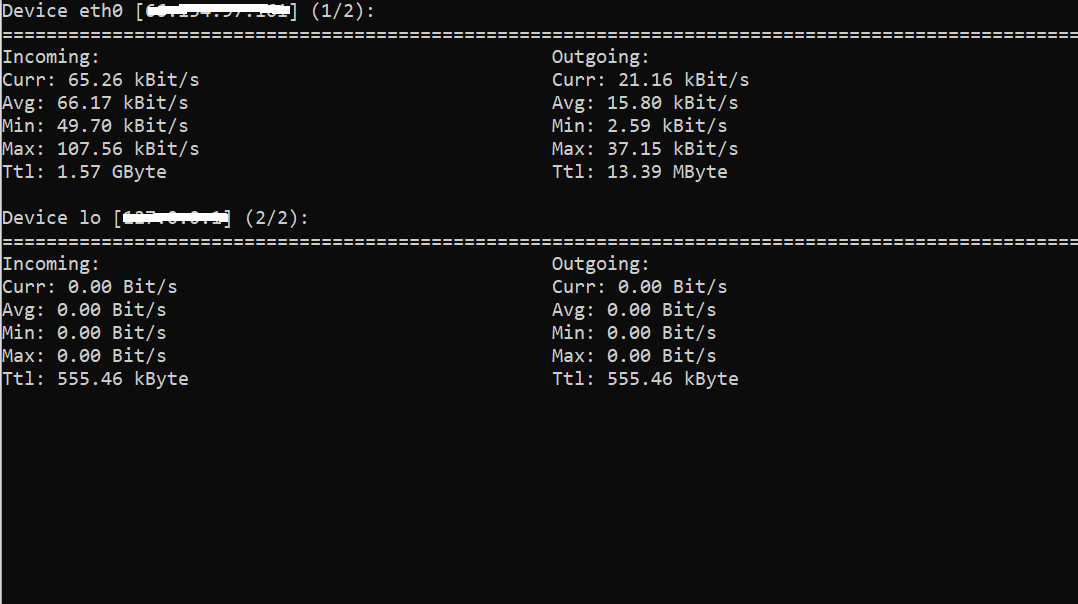
nload is a command-line utility to monitor network traffic. This tool only reports in-traffic and out-traffic. It displays a graph, which is helpful for a quick overview of network traffic. However, nload has a disadvantage as it does not display traffic by PID or by socket.
To install nload:
RHEL / CentOS
yum –y install nload
Debian / Ubuntu
sudo apt-get install nload
You can find more information at the link:
nload – Monitor bandwidth usage on Linux
NetHogs Monitor Network Traffic Bandwidth
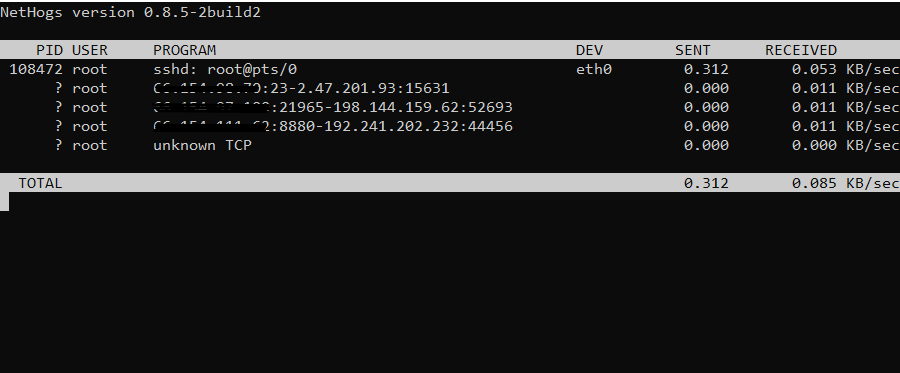
NetHogs generates real-time reports of network usage. One advantage of NetHogs is that it sorts by process/application and usage. This makes it a good utility for tracking bandwidth spikes (if you can launch it in time).
To install NetHogs:
RHEL / CentOS
yum –y install nethogs
Debian / Ubuntu
sudo apt-get install nethogs
How to Use NetHogs to Monitor Bandwidth By Process
To run the nethogs utility, type the following command under red-hat-based systems.
# nethogs
On Debian-based Linux, you must have root permissions, so run with the sudo command as shown.
$ sudo nethogs
Following are the nethogs command-line options. Using ‘-d‘ to add a refresh rate and ‘device name‘ to monitor specific given device or devices bandwidth (default is eth0).
For example, to set 5 seconds as your refresh rate, then type the command as.
# nethogs -d 5
$ sudo nethogs -d 5
To monitor specific device (eth0) network bandwidth only, use the command as.
# nethogs eth0
$ sudo nethogs eth0
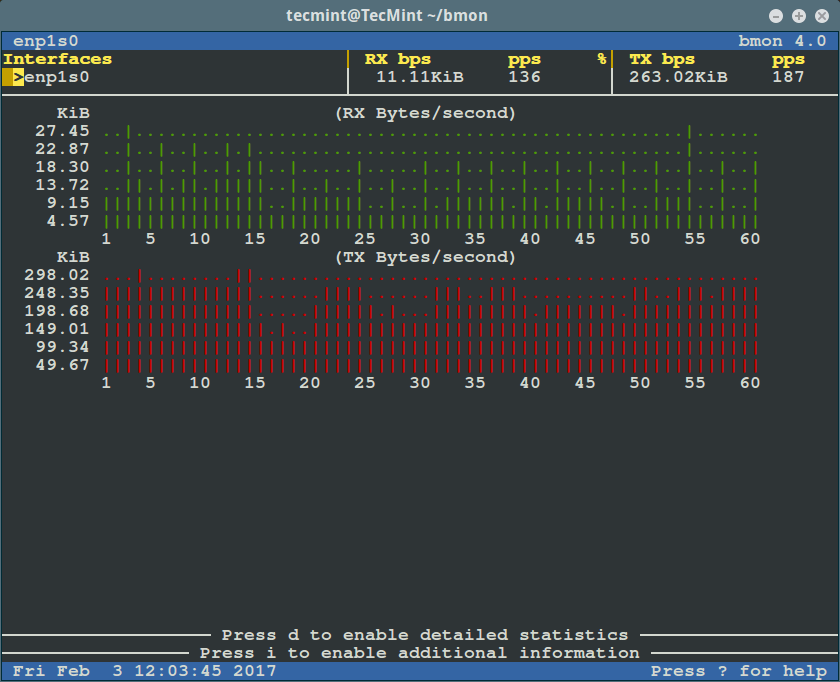
bmon Bandwidth Monitor and Rate Estimator
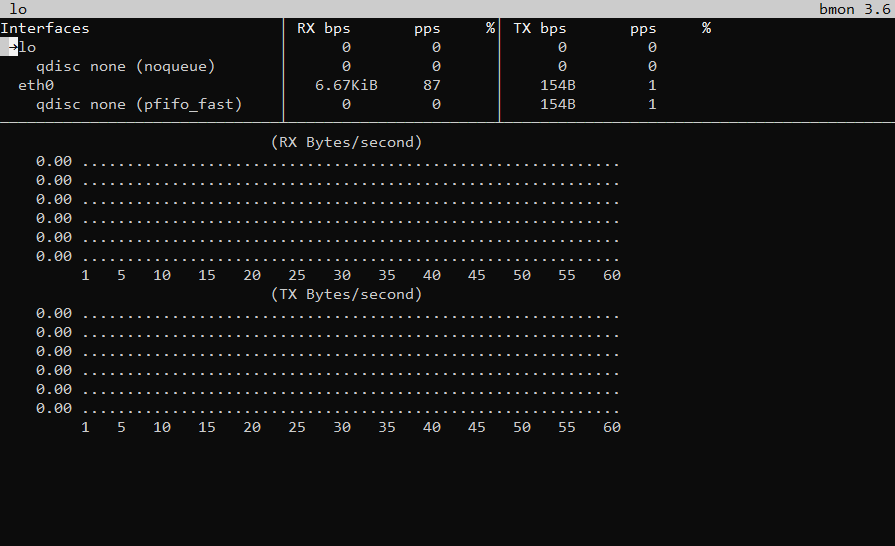
bmon monitors bandwidth utilization, along with keeping a running rate estimate. It breaks out usage by device, allowing you to track bandwidth across multiple network adapters. Another positive feature is that it creates a graph, which lets you see bandwidth usage at a glance.
To install bmon:
RHEL / CentOS
sudo yum install bmon
Debian / Ubuntu
sudo apt-get install bmon
How to Use bmon Bandwidth Monitoring Tool in Linux
Run it as below (for starters: RX means received bytes per second and TX refers to transmitted bytes per second):
$ bmon
To view more detailed graphical statistics/information of bandwidth usage, press d key and refer screnshot below.
Press [Shift + ?] to view the quick reference below. To exit the interface, press [Shift + ?] again.
The flag -p sets a policy defining which network interfaces to display, in the example below, we will be monitoring the eth0 network interface:
$ bmon -p eth0
To use bit per second instead of bytes per second, use the -b flag like so:
$ bmon -bp eth0
-r flag as follows:$ bmon -r 5 -p eth0
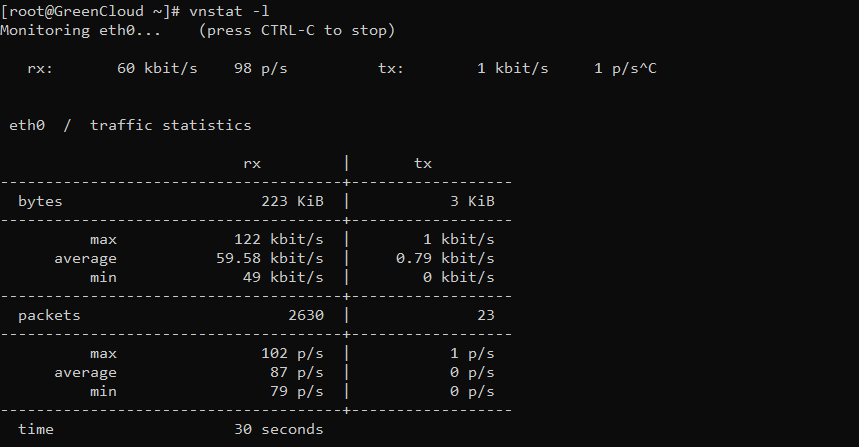
vnStat Network Traffic Monitor
VnStat works by running a daemon that captures and records bandwidth data. It reads from the kernel to stay light on resource usage. It can run in real-time by using the –l option. The real value lies in persistent records. As the daemon runs, it collects and stores bandwidth usage data.
The vnstati command can be used to display usage statistics. VnStat is best suited for statistical reporting.
To install vnStat:
RHEL / CentOS
yum -y install vnstat
Debian / Ubuntu
sudo apt-get install vnstat
Once installed, the default configuration should work for most people. Default will run on Network Interface is eth0. If you need to change the Network Interface, you will need to edit the following file.
nano /etc/vnstat.conf
Next, we need to create a database where the data will be collected and stored.
vnstat -u -i eth0
chown vnstat:vnstat /var/lib/vnstat/eth0
Finally start the service and start collecting data.
systemctl start vnstat
systemctl enable vnstat
Using vnstat
Using VnStat, you can view bandwidth statistics per day, per month and per hour. It also provides the option to display real-time statistics.
Show stats for a day
vnstat -d
Show statistics for a month
vnstat -m
Show stats for a week
vnstat -w
Show stats for an hour
vnstat -h
Show top 10 network statistics
vnstat -t
Real-time stats display
vnstat -l
iPerf/iPerf3 Network Bandwidth Measurement Tool
iPerf is for monitoring bandwidth by protocol, such as TCP and UDP.
This tool is best for tweaking and maximizing network performance for a particular protocol. One limitation is that it requires both a server and a client to test.
To install iPerf:
RHEL / CentOS:
yum –y install iperf3
Debian / Ubuntu:
sudo apt-get install iperf3
Graphical Bandwidth Monitoring Tools
The following tools are more graphical in their interface and display. Many of them offer a more robust suite of monitoring than the more simple command-line tools.
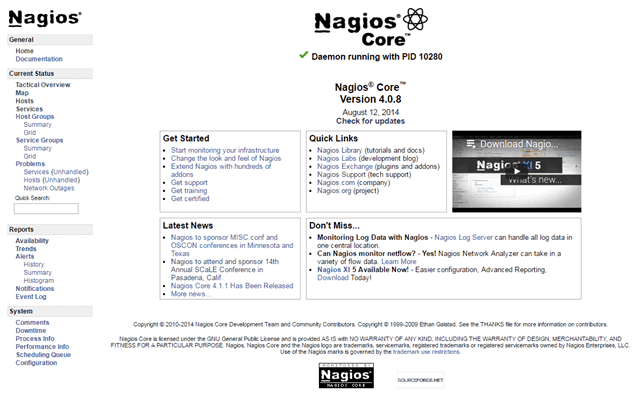
Nagios Core Monitors Systems, Networks and Infrastructure
Nagios has been a trusted open-source bandwidth monitoring tool for almost 20 years.
The interface runs through a web browser and offers multiple monitoring vectors. It can monitor across multiple network services, such as HTTP, POP3, and SMTP. It also has the ability to send notifications, such as when a problem occurs, or when an issue is resolved.
Nagios Core is a free open-source application. A paid, supported version is also available.
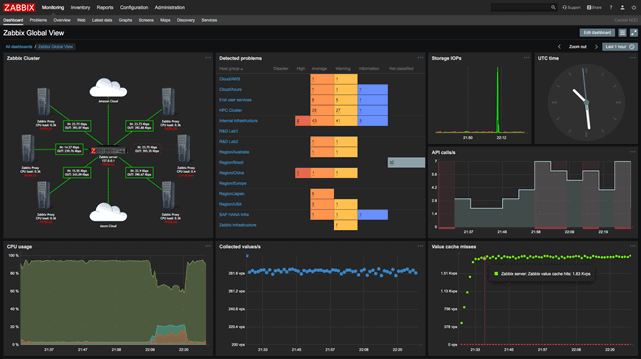
Zabbix Application and Network Monitoring Tool
Zabbix is a free open-source bandwidth monitoring application.
It runs in PHP in a web browser. Zabbix aims to simplify network monitoring, and it includes device and application monitoring. It generates data logs, which can be used to track and improve performance, and it can quickly scale between large and small applications. One advantage to Zabbox is that it can be used for free, even in large commercial applications.
You can refer to zabbix installation instructions at:
https://green.cloud/docs/how-to-install-zabbix-server-on-centos-7/
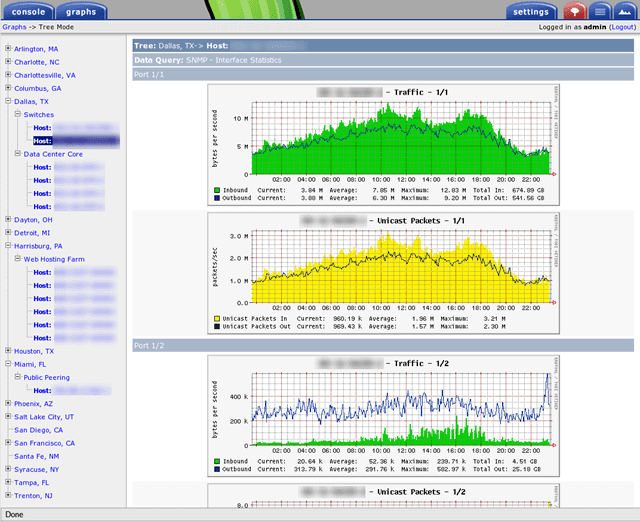
Cacti Network Monitoring and Graphing Tool
Cacti is a network monitoring tool that uses PHP and runs in a browser window.
The core strength in Cacti is its data collection and reporting. Cacti is not just limited to network bandwidth, it can also track other metrics like user permissions and access. Cacti uses scripts to gather data and compile it into meaningful charts and graphs.
You can refer to the installation instructions and Cacti Network Monitoring and Graphing Tool at:
https://green.cloud/docs/how-to-monitor-window-servers-with-cacti-using-snmp/
https://green.cloud/docs/how-to-monitor-device-using-icmp-ping-on-cacti-monitoring-tool/
Conclusion
This guide covered the top Linux system monitoring and network bandwidth tools. Experiment and compare a few options, consider your needs and the software capabilities to find one that suits you best.